Columbia Cycle Day Prediction
Summary of the Request
As much data as possible to assist with answering the below research question(s). The data needed would be from non-anovulatory women not taking oral contraceptives who could be considered “healthy.” The ideal variables (at least initially) include progesterone metabolites, estradiol, estrone, and estrogen metabolites (vs. only estrone metabolites listed in the data request document?) and any other covariates available . . Below I attempted to create research questions from the recording of the 8/2 meeting. Please comment and correct anything I may have misinterpreted.
Note
Important to note here that the assumption of a “healthy” status is a delicate assumption given that, in general, laboratory testing is ordered when a clinician is attempting to diagnose an issue. With the current exclusion criteria, this shouldn’t be a big deal and including non-healthy (but still cycling) women should, in theory, increase the generalizability of the model. A naive assumption is that a large portion of the women completing DUTCH cycle mapping are experiencing infertility or some potentially cyclical symptomatology.
Research Question 1 (Most Pressing)
How accurately does the model created using hormone concentrations from 18 women predict cycle day in a new cohort of women?
Note
I see this as essentially looking for a test set for the model previously trained on 18 women. Because this test set will be much larger, I wonder if it would be prudent to retrain the model based on a larger number of training observations and then use a smaller test set (like the standard 80/20 or 75/25 train-test split)?
Research Question 2
Can we create a reasonably accurate model for predicting cycle day from a larger number of predictors? Or, alternatively, is there a more accurate model that can be created using a larger number of predictors?
Note
A key question here might be how important is the interpretability of the model? Or how is feature/predictor importance quantified in the current approach? Would alternatively approaches result in substantially different rankings for relative feature/predictor importance?
Potential Research Question 3
How accurately can the model predict cycle phase (luteal vs. follicular)?
Note
This is a somewhat implied research question (and was hinted at by Dr. Herbstman in the meeting), but it could be particularly interesting and useful in some settings. Additionally this would present an opportunity to use non-cycle map data (which would greatly increase the number of observations available) to test hypotheses related to models created to predict cycle day, with the assumption being that if a model can accurately predict cycle day within 2-3 days, then it should be extremely accurate at predicting cycle phase (with an interesting potential hypothesis of some bias to the errors). This could potentially represent a broader application of the resulting model.
Note
In reference to the above note, in reading through the manuscript, the way in which the error is assigned (for theta = 28, theta hats of 26 and 2 are both assigned an error of 2, with sign indicating the direction of the error…) does not optimize for cycle phase determination.
Options
Option 1
Use data collected from 12/2015 - 1/2020 under previous IRB. This includes data from 2435 women who completed DUTCH Cycle Mapping. A brief EDA using this/these data is below.
Considerations
Inclusion/exclusion criteria will likely remove a moderate number of observations given the goal of the research (see below for details in context like age, cycle length, etc.)
This approach would only require a data transfer agreement (vs. a data use agreement + IRB approval since it is completely de-identified human subject data).
However, this would still likely require a modification to the IRB in place
NoteThis is an important trend related to effort and return on investment for expended effort regarding IRB modification/submission (i.e., does it make sense to put in a little more effort regarding the IRB to set up a longer term and more useful data mining resource?)
Option 2
Use all available cycle map data (from 12/2015 to present). I’m still working on a SQL query to get an accurate number of how many additional women this would add, however, a reasonable estimate would be 1.5 - 2X the number in option 1.
Could also consider adding non-cycle map data here to explore the accuracy of cycle phase prediction…
Considerations
This increased number is important to consider here given the number of observations that will likely be lost to inclusion/exclusion criteria (again…age, cycle length, etc.)
This would require a new IRB application, or, more accurately, an IRB exemption since all data would be de-identified (or potentially a modification?).
- Note
This brings up an important point, which is the mechanism for sharing data. This seems like a good project for REDCap. We have a REDCap instance as I’m sure you all do as well and this may facilitate more streamlined and compliant data sharing.
The time commitment here for pulling and cleaning the data is more than the near zero time for option 1 (however, this is a super cool project and I’d be willing to dedicate a solid amount of non-paid/non-work/free time to helping out because this kind of stuff is super fun for me!).
Note
“How much more time?” you might ask. Not quite sure until I get started and see what shape the data is currently in, but at least a couple of weeks. Another potential approach is to use the option 1 data as training data and use the data from 1/2020 - present as test data.
Option 3
Use all available cycle map data from (12/2015 to present) + non-cycle map data (for cycle phase prediction) + collect cycle day information from incoming non-cycle map (so cross-sectional samples…would be self-reported, but if the question is asked prospectively this could increase accuracy or at least allow for the comparison of self-reported data and model-generated data, especially if the model is performing well).
Considerations
The cycle phase prediction piece is “easy” data to get (relatively)
Collecting cycle day information from incoming non-cycle map data would add some additional effort, but could greatly increase the importance of the results and the perceived validity
- The much better alternative here would be a prospective study where cycle day is more rigorously collected (perhaps via a cycle monitoring app), but that isn’t currently feasible (but maybe there’s a grant application in the future??)
This would require a new IRB application/exemption/modification
Option 2 could be used prior to this option or while data collection is ongoing and this could then be a follow up study. There is also an opportunity here to put a model into “production” for broader use and then collect exponentially more data.
Questions
How does this model perform compared to other types of supervised learning models (gradient boosted decision trees, random forest, multi-class SVM, etc.)
- This might be more relevant for the potential research question 3 which reduces this to a binary classification problem, but a multi-class SVM approach is an interesting consideration.
How is variation in cycle length accounted for or is having a 28-day cycle required for inclusion (if so, this would eliminate a substantial number of observations)?
- Note
It is important to note here that, in general, cycle length will vary quite a bit; so if the existing model is inflexible to cycle lengths that deviate from 28 days, the clinical utility may be limited
There is dependence among samples from the same patient. How is this handled?
Brief EDA
Below are the first 100 entries so that you can get an idea of the shape of the data.
To Do
Join other data with age + …
Variable Exploration
Age
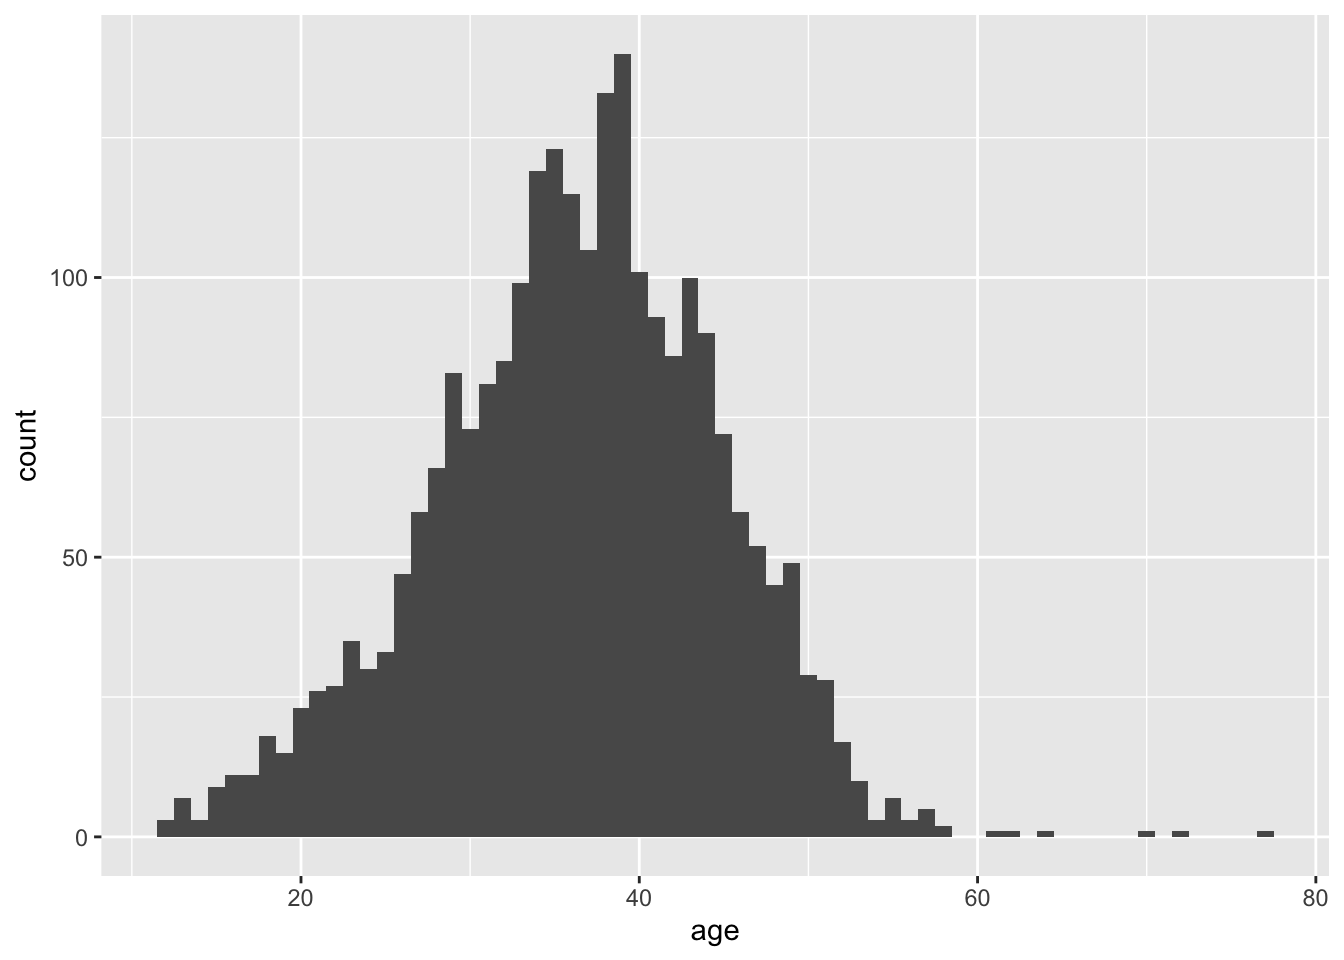
There are 9 rows with NA values for age…this means age is missing for 1 person
A maximum age would need to be set as exclusion criteria to exclude women who are likely to be peri or postmenopausal.
# A tibble: 9 × 18
  accession_id accession_id1 patient_id age_at_collection   bmi day_of_cycle
  <chr>        <chr>         <chr>                  <dbl> <dbl>        <dbl>
1 321471       321471        611866                    NA  20.4           34
2 321471       321471        611866                    NA  20.4           22
3 321471       321471        611866                    NA  20.4           29
4 321471       321471        611866                    NA  20.4           25
5 321471       321471        611866                    NA  20.4           11
6 321471       321471        611866                    NA  20.4           15
7 321471       321471        611866                    NA  20.4            4
8 321471       321471        611866                    NA  20.4           20
9 321471       321471        611866                    NA  20.4           17
# ℹ 12 more variables: creatinine <dbl>, a_pregnanediol <dbl>,
#   b_pregnanediol <dbl>, estrone <dbl>, estradiol <dbl>, estriol <dbl>,
#   x2_ohe1 <dbl>, x4_ohe1 <dbl>, x16_ohe1 <dbl>, x2_meth_e1 <dbl>,
#   x2_ohe2 <dbl>, single_or_quad <dbl>
# A tibble: 2,435 × 2
patient_id age_at_collection
<chr> <dbl>
1 020303 44
2 020313 45
3 020323 30
4 020333 16
5 020357 44
6 020367 41
7 020372 42
8 020382 40
9 021104 24
10 021114 38
# ℹ 2,425 more rowsBMI
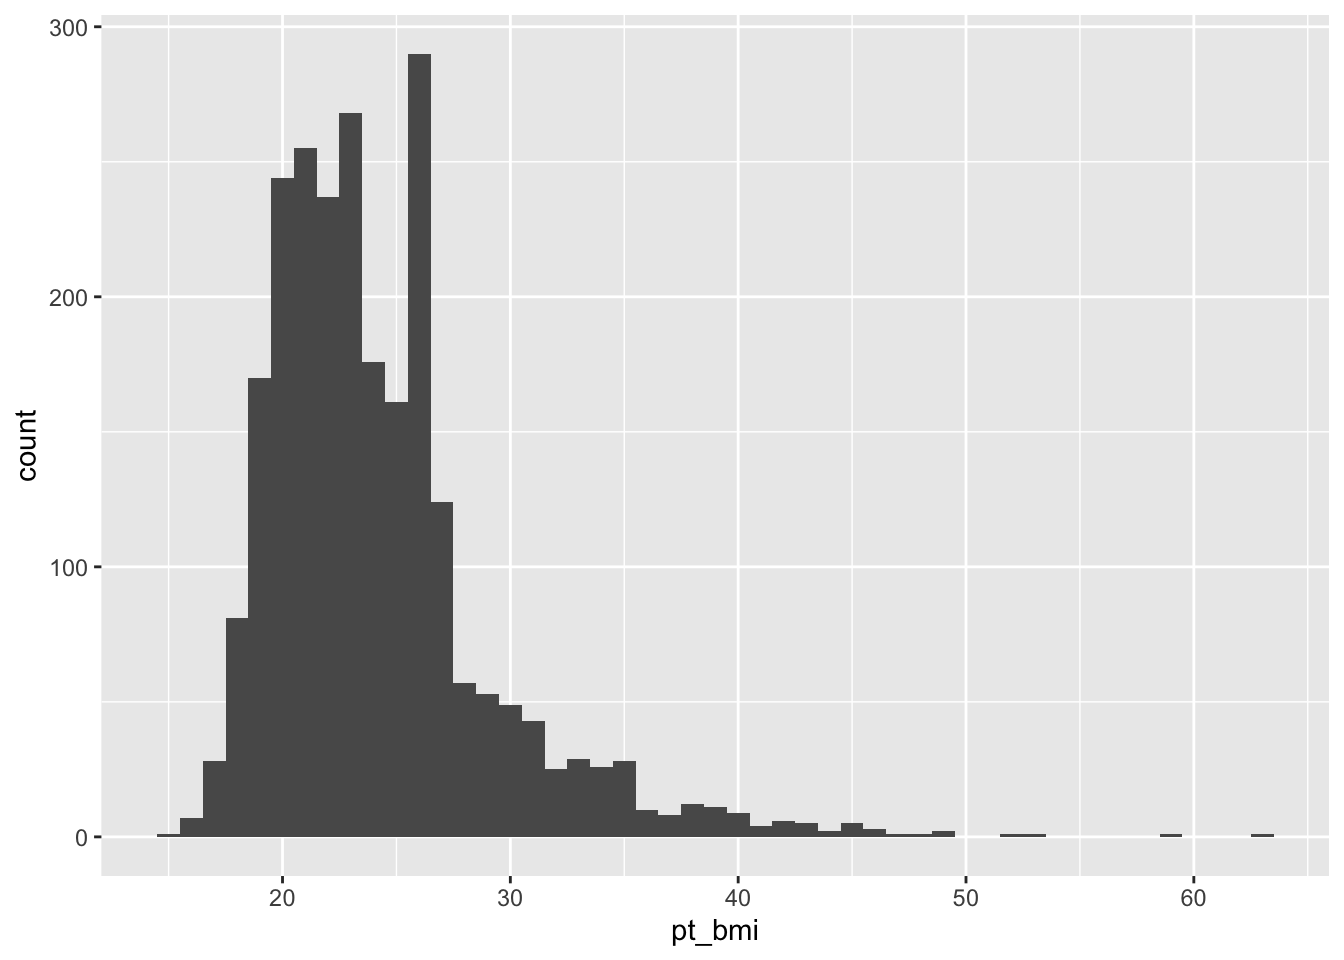
Might consider excluding those with extreme BMIs as this may either be inaccurate (self-reported) or influence cycle characteristics.
The extremely low BMIs seem particularly concerning…it is likely that these are inaccurate
Day of Cycle
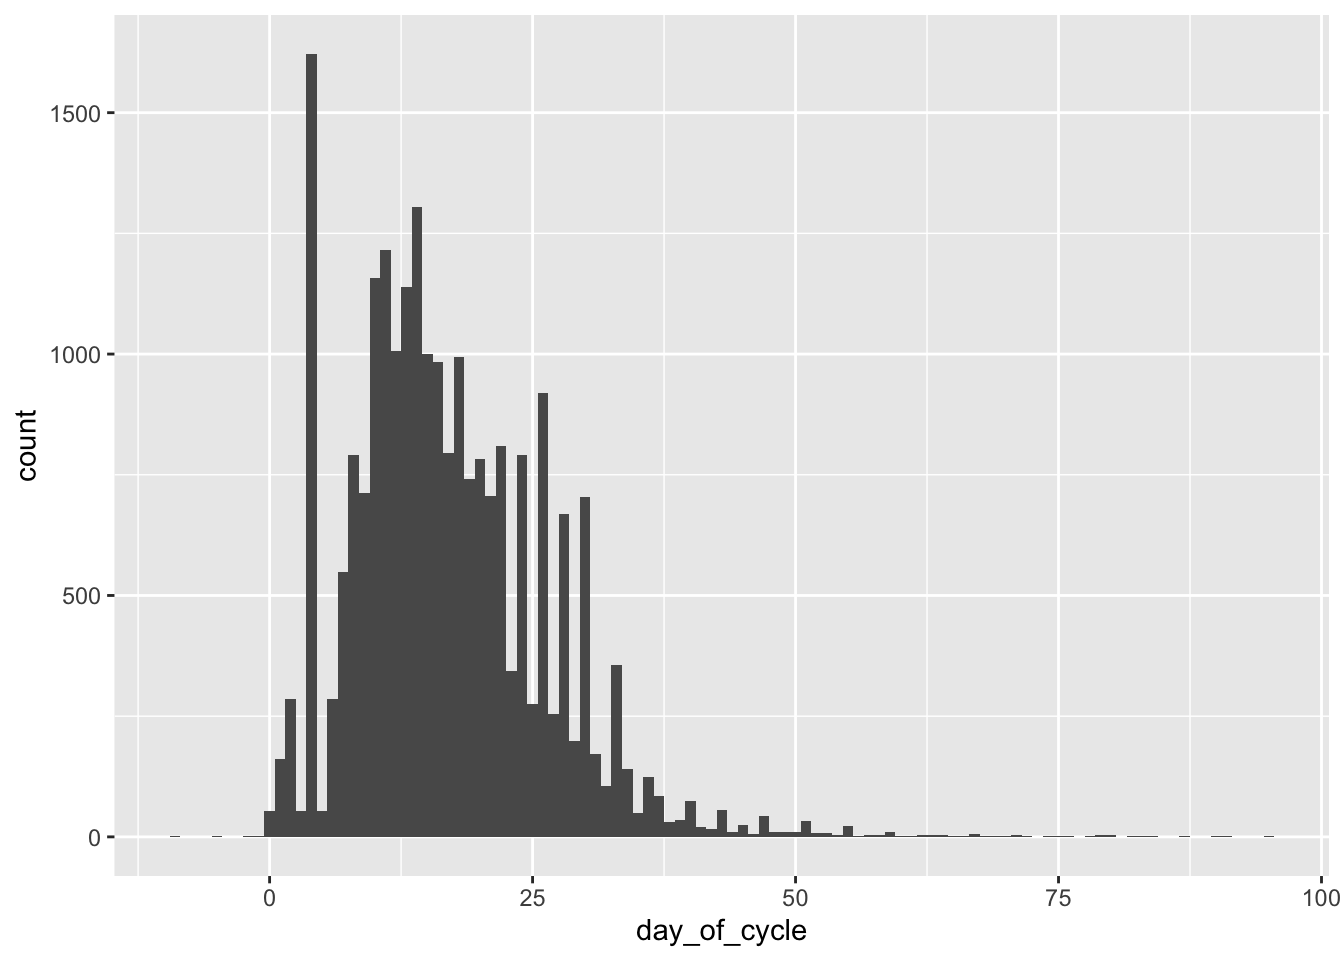
The above demonstrates the issue with variable cycle lengths and with potential self-reporting errors. Exclusion criteria will need to be established here.
Creatinine
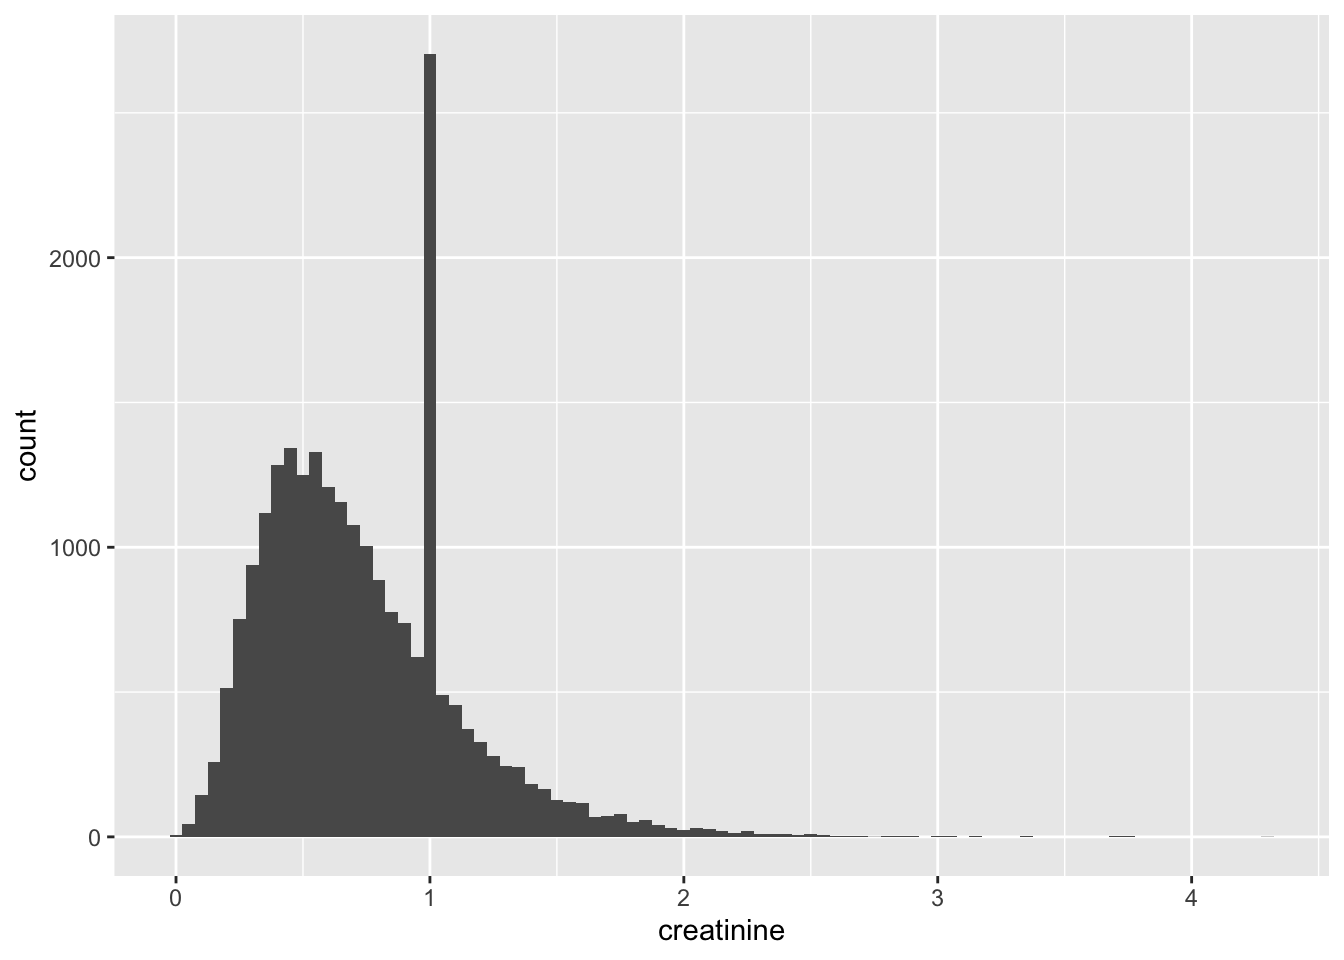
The large peak at 1 suggests that this was potentially an “imputed” value (at some point in the lab methodology). This likely means that this variable might not be very useful as a predictor unless all observations with a value of 1 are excluded.
Alpha-Pregnanediol
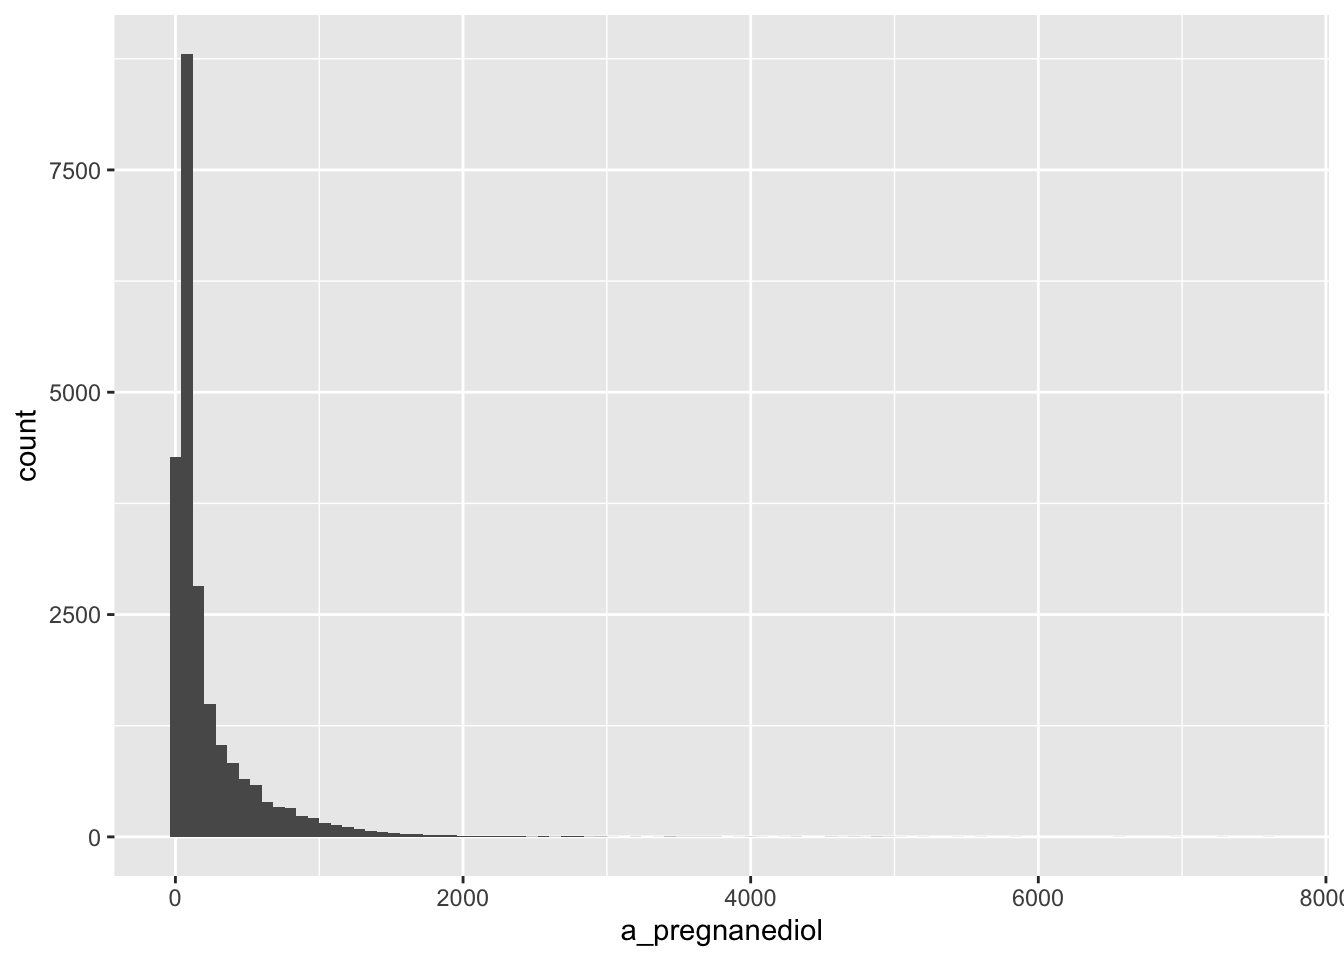
From the warning message on the histogram, it appears that there are some missing values
# A tibble: 5 × 18
  accession_id accession_id1 patient_id age_at_collection   bmi day_of_cycle
  <chr>        <chr>         <chr>                  <dbl> <dbl>        <dbl>
1 048414       048414        130321                    44  18.9            4
2 048434       048434        030698                    52  19.8            4
3 048474       048474        130351                    42  20.2            4
4 048484       048484        517933                    39  24.8            4
5 048493       048493        130311                    21  22.1            4
# ℹ 12 more variables: creatinine <dbl>, a_pregnanediol <dbl>,
#   b_pregnanediol <dbl>, estrone <dbl>, estradiol <dbl>, estriol <dbl>,
#   x2_ohe1 <dbl>, x4_ohe1 <dbl>, x16_ohe1 <dbl>, x2_meth_e1 <dbl>,
#   x2_ohe2 <dbl>, single_or_quad <dbl>
Decision would need to be made here around how to handle missing values.
Beta-Pregnanediol
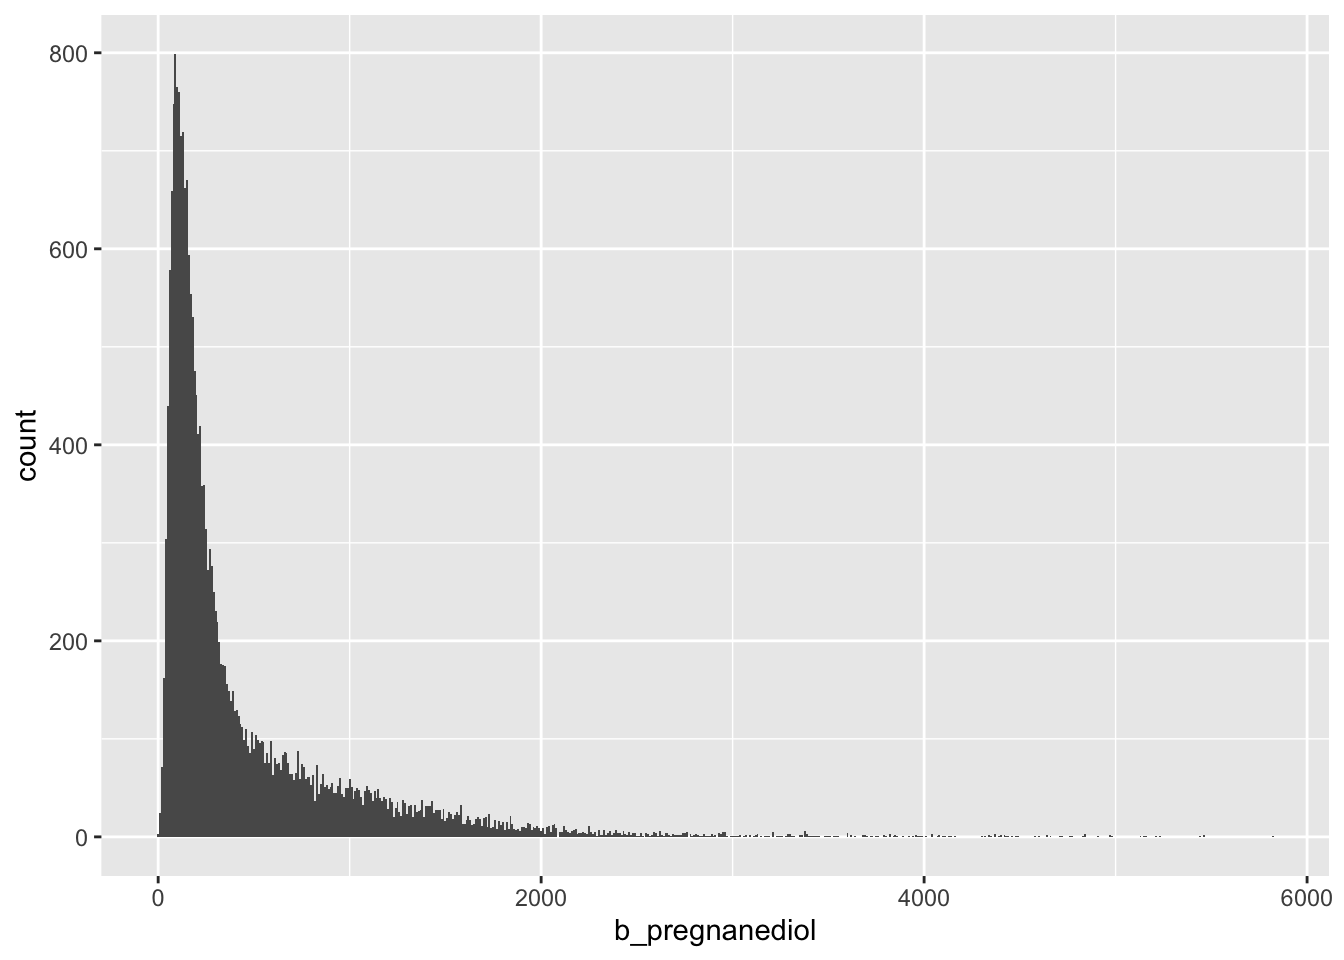
Missing values here as well…would like to see if these are the same as the missing values for alpha pregnanediol
# A tibble: 5 × 18
  accession_id accession_id1 patient_id age_at_collection   bmi day_of_cycle
  <chr>        <chr>         <chr>                  <dbl> <dbl>        <dbl>
1 048414       048414        130321                    44  18.9            4
2 048434       048434        030698                    52  19.8            4
3 048474       048474        130351                    42  20.2            4
4 048484       048484        517933                    39  24.8            4
5 048493       048493        130311                    21  22.1            4
# ℹ 12 more variables: creatinine <dbl>, a_pregnanediol <dbl>,
#   b_pregnanediol <dbl>, estrone <dbl>, estradiol <dbl>, estriol <dbl>,
#   x2_ohe1 <dbl>, x4_ohe1 <dbl>, x16_ohe1 <dbl>, x2_meth_e1 <dbl>,
#   x2_ohe2 <dbl>, single_or_quad <dbl>
Yes. These are the same patients/accessions with missing alpha and beta pregnanediol values.
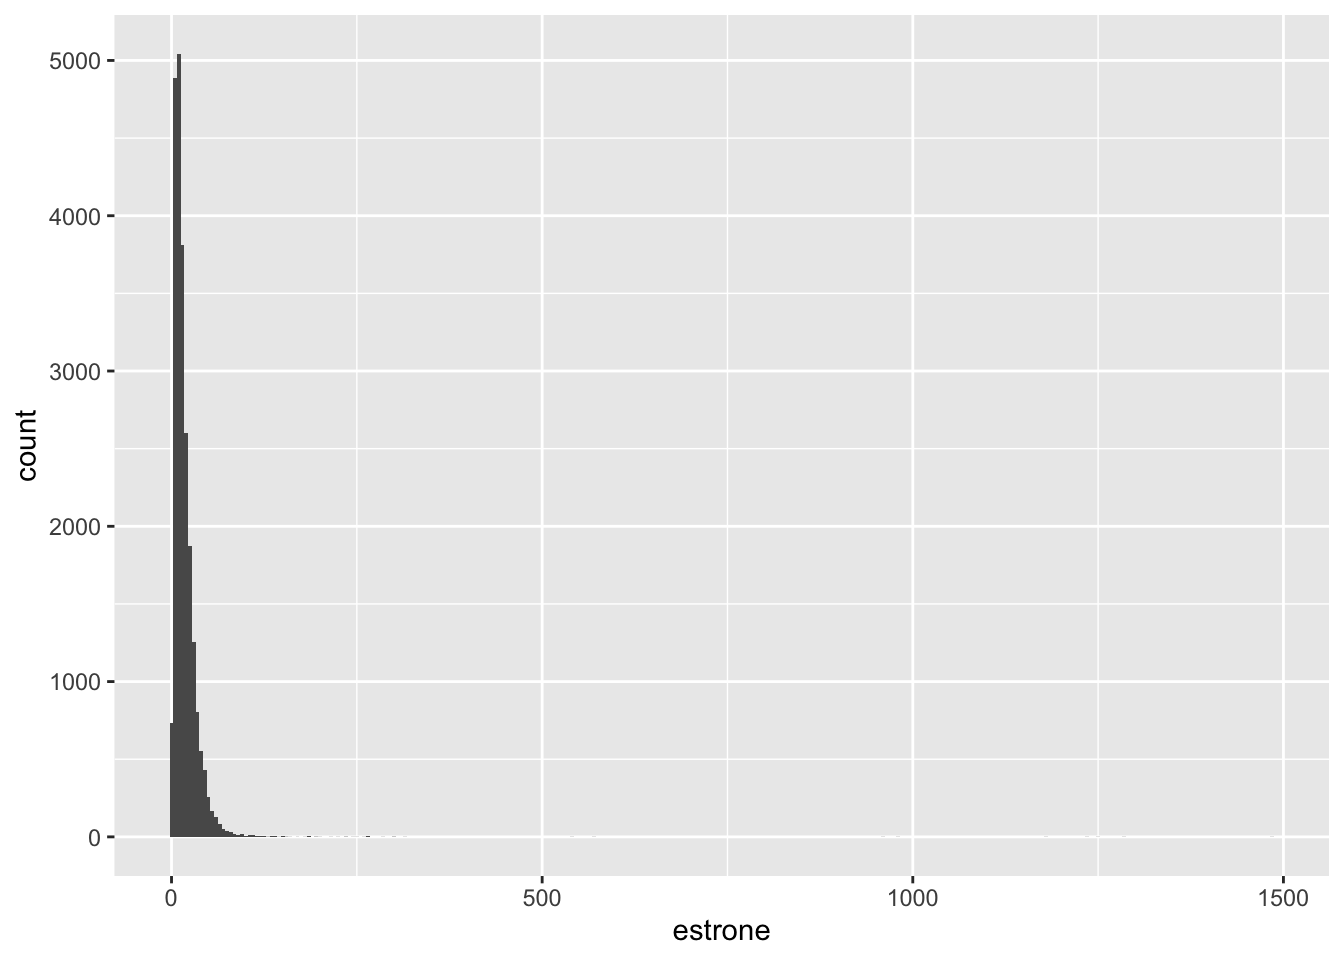
Estrone
# A tibble: 5 × 18
  accession_id accession_id1 patient_id age_at_collection   bmi day_of_cycle
  <chr>        <chr>         <chr>                  <dbl> <dbl>        <dbl>
1 048414       048414        130321                    44  18.9            4
2 048434       048434        030698                    52  19.8            4
3 048474       048474        130351                    42  20.2            4
4 048484       048484        517933                    39  24.8            4
5 048493       048493        130311                    21  22.1            4
# ℹ 12 more variables: creatinine <dbl>, a_pregnanediol <dbl>,
#   b_pregnanediol <dbl>, estrone <dbl>, estradiol <dbl>, estriol <dbl>,
#   x2_ohe1 <dbl>, x4_ohe1 <dbl>, x16_ohe1 <dbl>, x2_meth_e1 <dbl>,
#   x2_ohe2 <dbl>, single_or_quad <dbl>
Again, same 5 patients + accessions with missing values
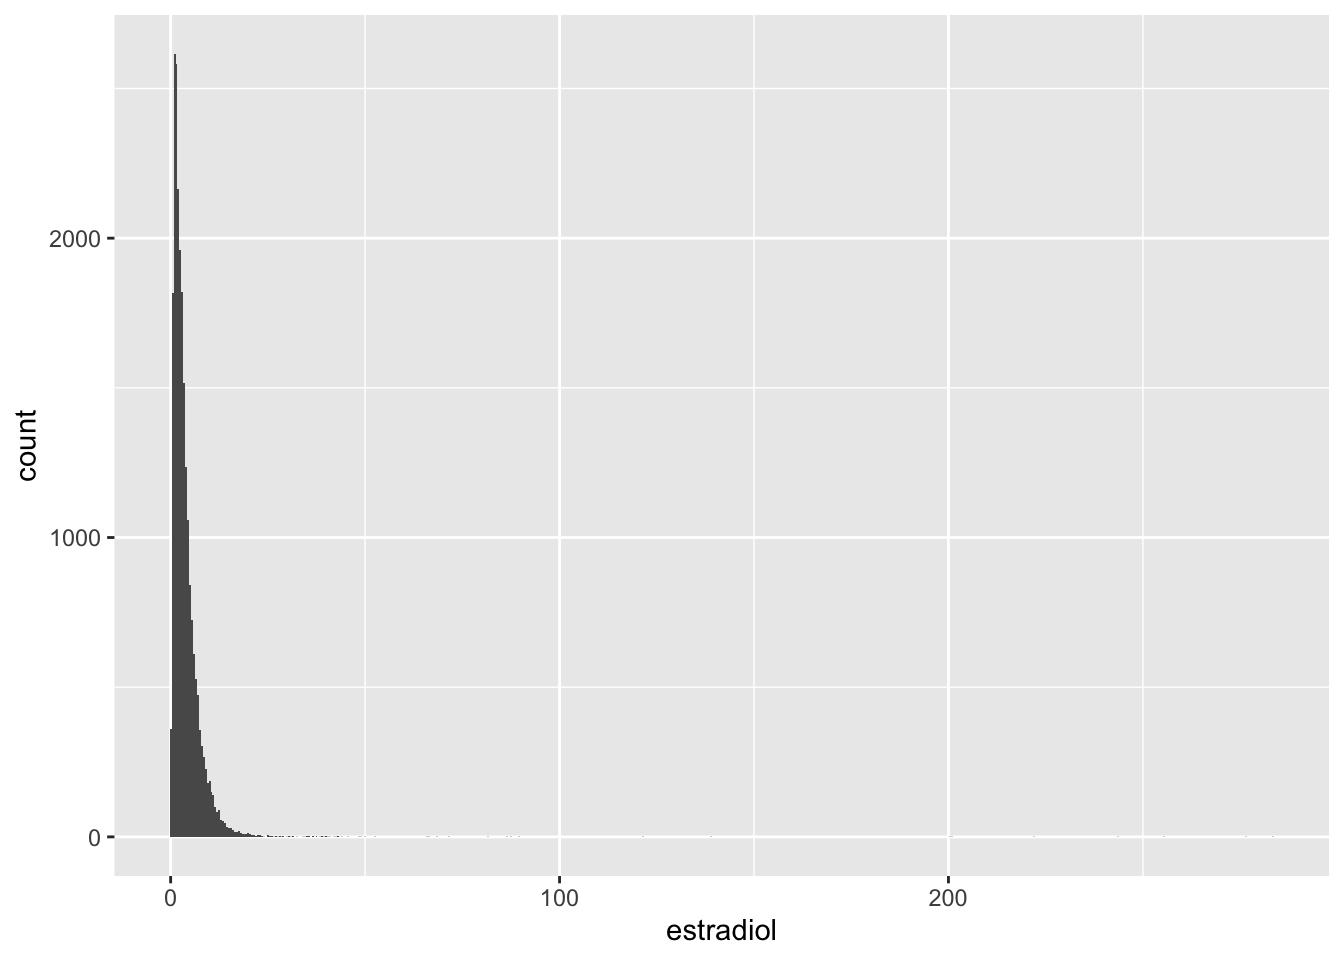
Estradiol
# A tibble: 5 × 18
  accession_id accession_id1 patient_id age_at_collection   bmi day_of_cycle
  <chr>        <chr>         <chr>                  <dbl> <dbl>        <dbl>
1 048414       048414        130321                    44  18.9            4
2 048434       048434        030698                    52  19.8            4
3 048474       048474        130351                    42  20.2            4
4 048484       048484        517933                    39  24.8            4
5 048493       048493        130311                    21  22.1            4
# ℹ 12 more variables: creatinine <dbl>, a_pregnanediol <dbl>,
#   b_pregnanediol <dbl>, estrone <dbl>, estradiol <dbl>, estriol <dbl>,
#   x2_ohe1 <dbl>, x4_ohe1 <dbl>, x16_ohe1 <dbl>, x2_meth_e1 <dbl>,
#   x2_ohe2 <dbl>, single_or_quad <dbl>
Again, same 5 patients + accessions with missing values
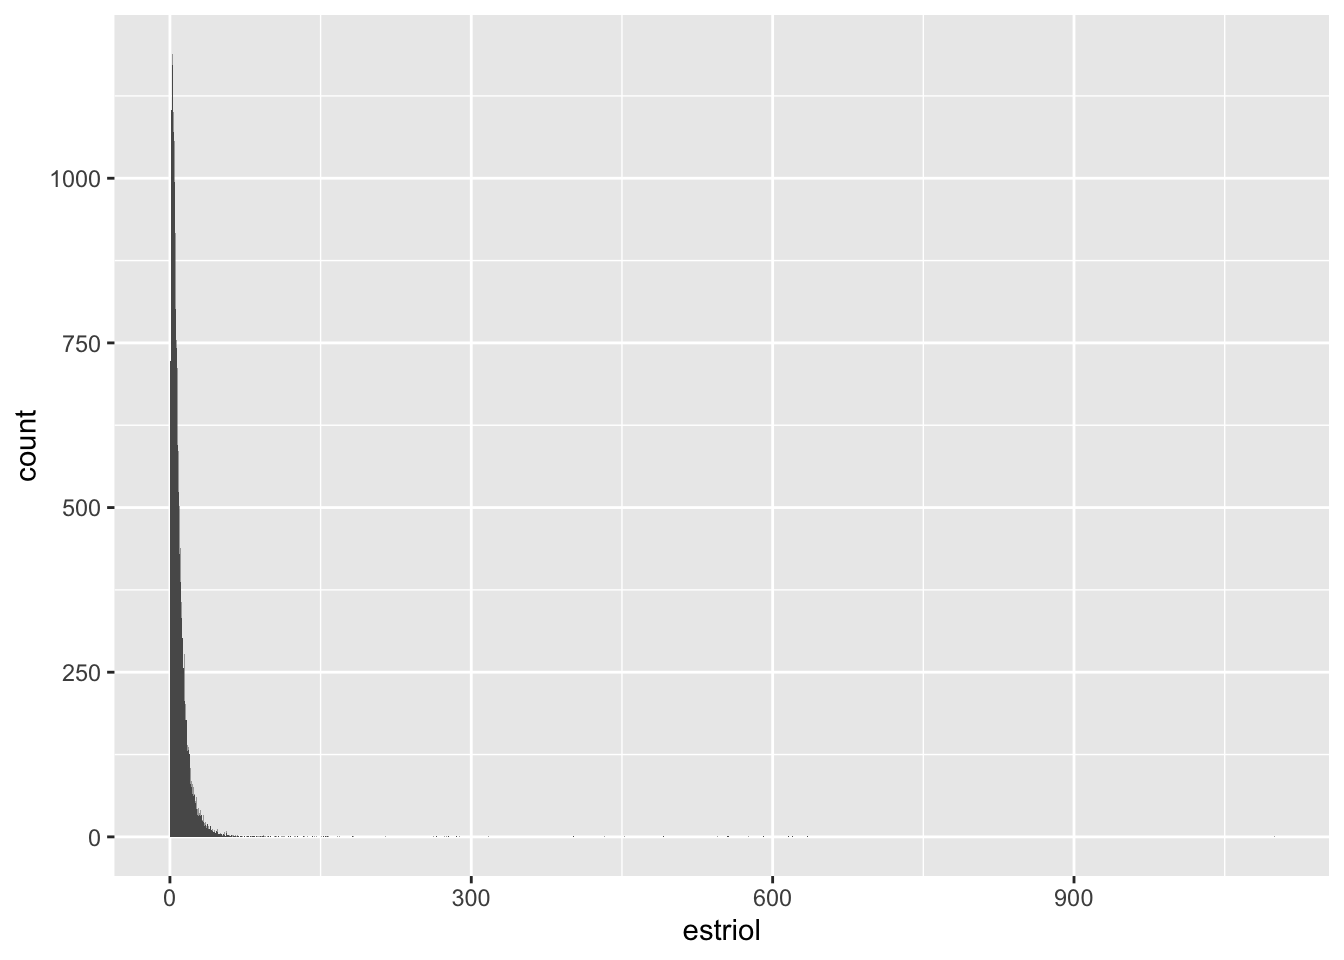
Estriol
# A tibble: 5 × 18
  accession_id accession_id1 patient_id age_at_collection   bmi day_of_cycle
  <chr>        <chr>         <chr>                  <dbl> <dbl>        <dbl>
1 048414       048414        130321                    44  18.9            4
2 048434       048434        030698                    52  19.8            4
3 048474       048474        130351                    42  20.2            4
4 048484       048484        517933                    39  24.8            4
5 048493       048493        130311                    21  22.1            4
# ℹ 12 more variables: creatinine <dbl>, a_pregnanediol <dbl>,
#   b_pregnanediol <dbl>, estrone <dbl>, estradiol <dbl>, estriol <dbl>,
#   x2_ohe1 <dbl>, x4_ohe1 <dbl>, x16_ohe1 <dbl>, x2_meth_e1 <dbl>,
#   x2_ohe2 <dbl>, single_or_quad <dbl>
Again, same 5 patients + accessions with missing values
2-OHE1

# A tibble: 5 × 18
  accession_id accession_id1 patient_id age_at_collection   bmi day_of_cycle
  <chr>        <chr>         <chr>                  <dbl> <dbl>        <dbl>
1 048414       048414        130321                    44  18.9            4
2 048434       048434        030698                    52  19.8            4
3 048474       048474        130351                    42  20.2            4
4 048484       048484        517933                    39  24.8            4
5 048493       048493        130311                    21  22.1            4
# ℹ 12 more variables: creatinine <dbl>, a_pregnanediol <dbl>,
#   b_pregnanediol <dbl>, estrone <dbl>, estradiol <dbl>, estriol <dbl>,
#   x2_ohe1 <dbl>, x4_ohe1 <dbl>, x16_ohe1 <dbl>, x2_meth_e1 <dbl>,
#   x2_ohe2 <dbl>, single_or_quad <dbl>
Again, same 5 patients + accessions with missing values
4-OHE1

# A tibble: 5 × 18
  accession_id accession_id1 patient_id age_at_collection   bmi day_of_cycle
  <chr>        <chr>         <chr>                  <dbl> <dbl>        <dbl>
1 048414       048414        130321                    44  18.9            4
2 048434       048434        030698                    52  19.8            4
3 048474       048474        130351                    42  20.2            4
4 048484       048484        517933                    39  24.8            4
5 048493       048493        130311                    21  22.1            4
# ℹ 12 more variables: creatinine <dbl>, a_pregnanediol <dbl>,
#   b_pregnanediol <dbl>, estrone <dbl>, estradiol <dbl>, estriol <dbl>,
#   x2_ohe1 <dbl>, x4_ohe1 <dbl>, x16_ohe1 <dbl>, x2_meth_e1 <dbl>,
#   x2_ohe2 <dbl>, single_or_quad <dbl>
Again, same 5 patients + accessions with missing values
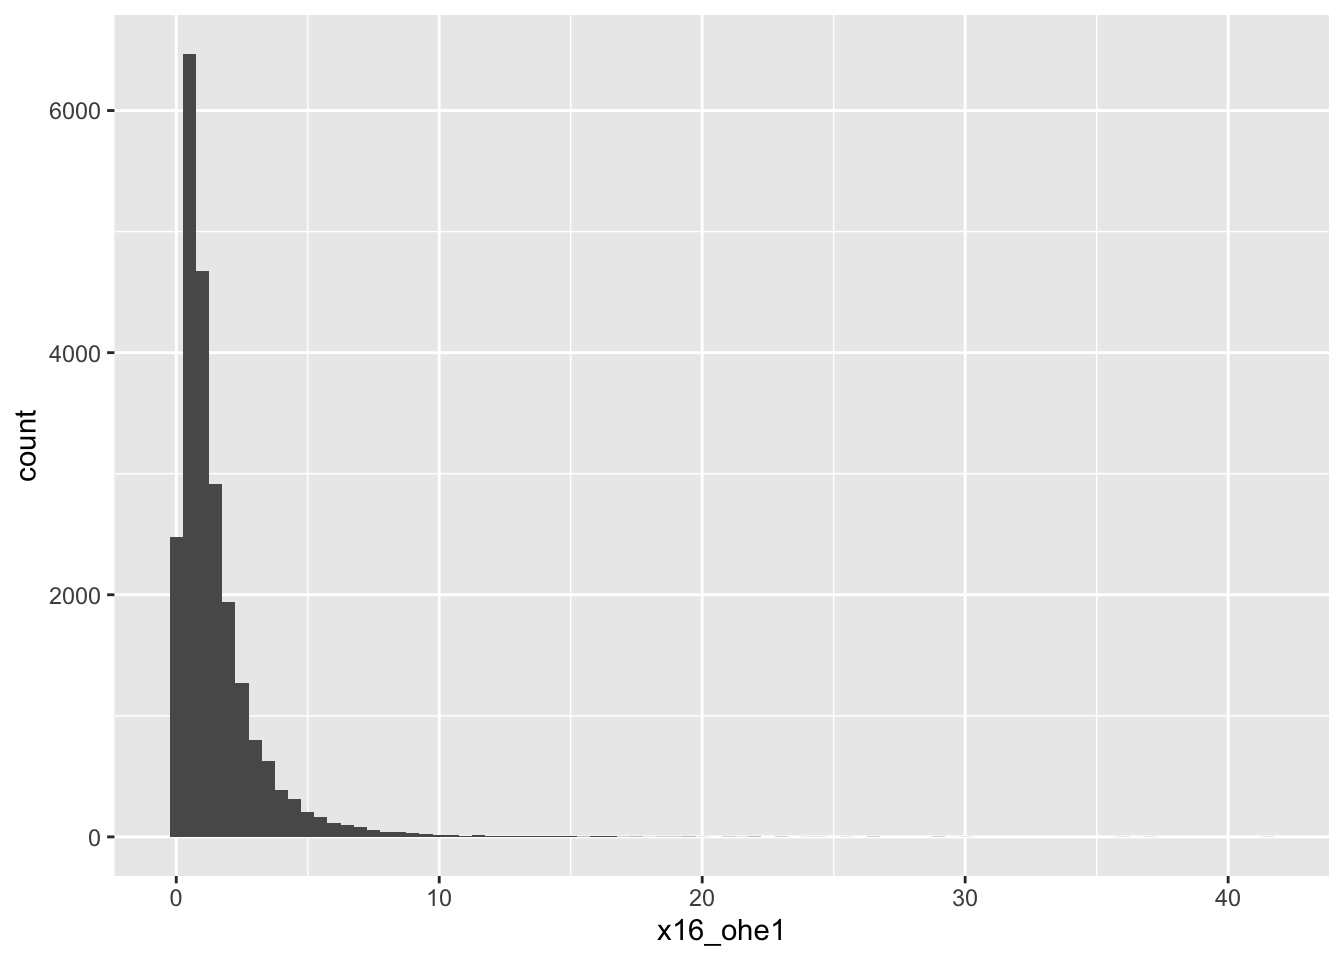
16-OHE1
# A tibble: 5 × 18
accession_id accession_id1 patient_id age_at_collection bmi day_of_cycle
<chr> <chr> <chr> <dbl> <dbl> <dbl>
1 048414 048414 130321 44 18.9 4
2 048434 048434 030698 52 19.8 4
3 048474 048474 130351 42 20.2 4
4 048484 048484 517933 39 24.8 4
5 048493 048493 130311 21 22.1 4
# ℹ 12 more variables: creatinine <dbl>, a_pregnanediol <dbl>,
# b_pregnanediol <dbl>, estrone <dbl>, estradiol <dbl>, estriol <dbl>,
# x2_ohe1 <dbl>, x4_ohe1 <dbl>, x16_ohe1 <dbl>, x2_meth_e1 <dbl>,
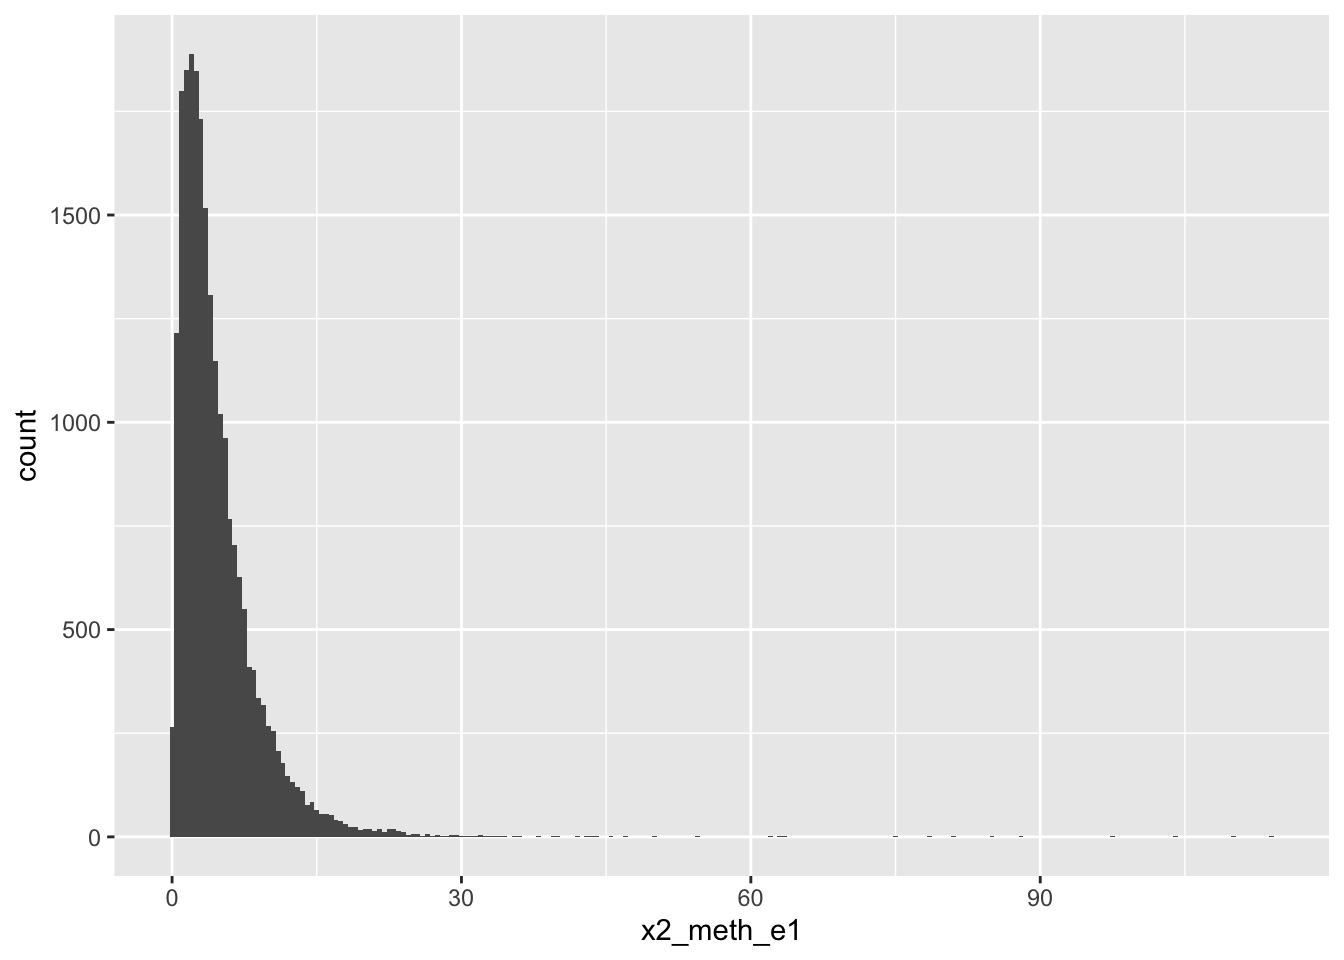
# x2_ohe2 <dbl>, single_or_quad <dbl>2-Methoxy-E1
# A tibble: 5 × 18
  accession_id accession_id1 patient_id age_at_collection   bmi day_of_cycle
  <chr>        <chr>         <chr>                  <dbl> <dbl>        <dbl>
1 048414       048414        130321                    44  18.9            4
2 048434       048434        030698                    52  19.8            4
3 048474       048474        130351                    42  20.2            4
4 048484       048484        517933                    39  24.8            4
5 048493       048493        130311                    21  22.1            4
# ℹ 12 more variables: creatinine <dbl>, a_pregnanediol <dbl>,
#   b_pregnanediol <dbl>, estrone <dbl>, estradiol <dbl>, estriol <dbl>,
#   x2_ohe1 <dbl>, x4_ohe1 <dbl>, x16_ohe1 <dbl>, x2_meth_e1 <dbl>,
#   x2_ohe2 <dbl>, single_or_quad <dbl>
Again, same 5 patients + accessions with missing values
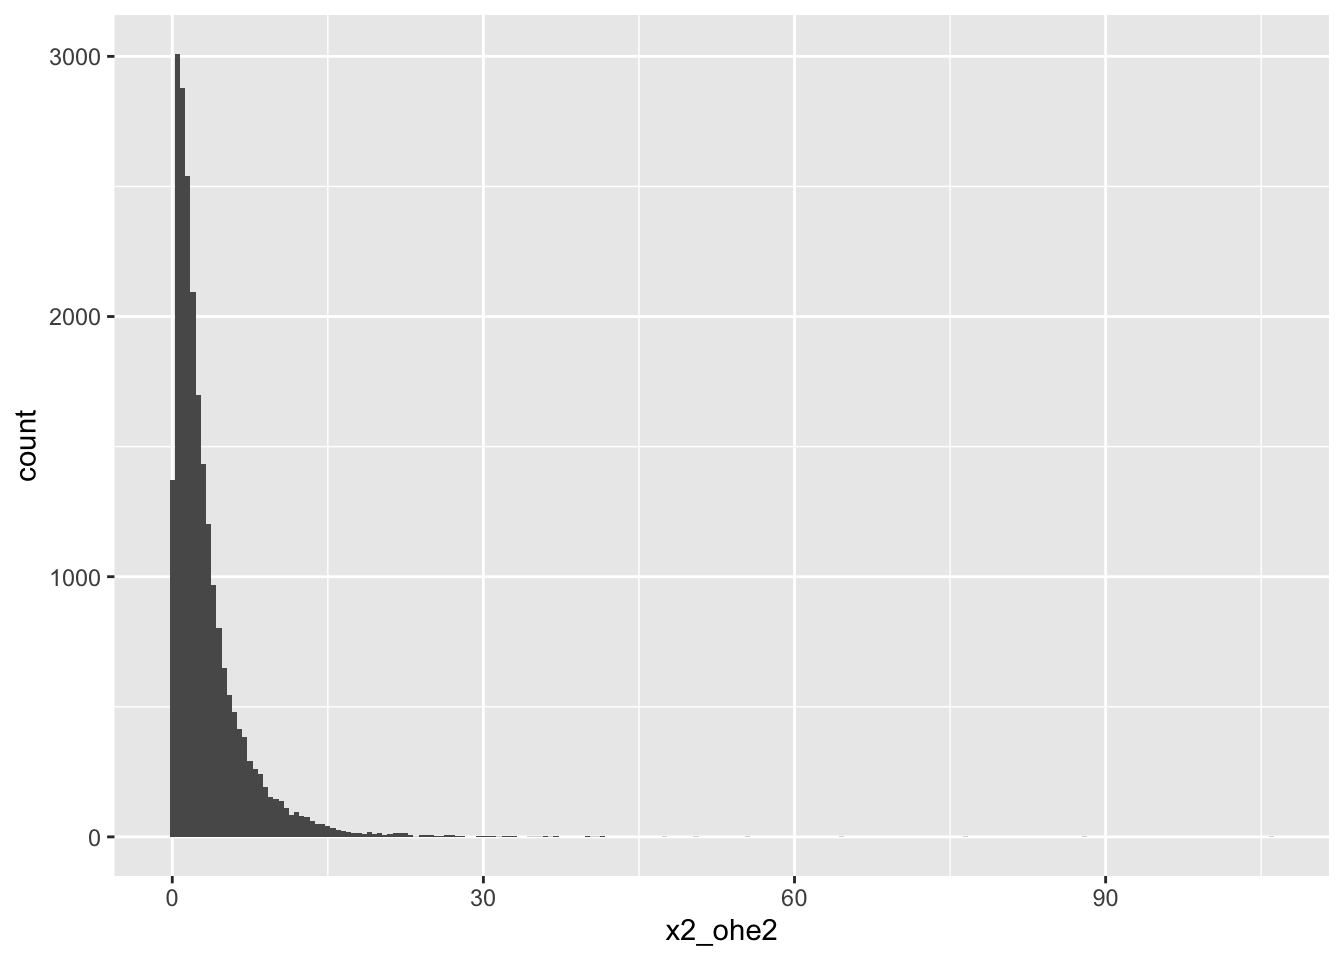
2-OHE2
# A tibble: 7 × 18
  accession_id accession_id1 patient_id age_at_collection   bmi day_of_cycle
  <chr>        <chr>         <chr>                  <dbl> <dbl>        <dbl>
1 048414       048414        130321                    44  18.9            4
2 048434       048434        030698                    52  19.8            4
3 048474       048474        130351                    42  20.2            4
4 048484       048484        517933                    39  24.8            4
5 048493       048493        130311                    21  22.1            4
6 732860       732860        928021                    33  23.6            4
7 732880       732880        928031                    32  19.9            4
# ℹ 12 more variables: creatinine <dbl>, a_pregnanediol <dbl>,
#   b_pregnanediol <dbl>, estrone <dbl>, estradiol <dbl>, estriol <dbl>,
#   x2_ohe1 <dbl>, x4_ohe1 <dbl>, x16_ohe1 <dbl>, x2_meth_e1 <dbl>,
#   x2_ohe2 <dbl>, single_or_quad <dbl>
There are 7 patients missing values for 2OHE2; 5 of them are the same patients that have been missing other values. The other 2 observations with missing values are 2 new patients + accessions.